Dow Jones, S&P Now Bearish for the Holidays? It's the most Volatile Time of the Year!
Is the bull party coming to an end for stocks in 2024? As expected, US Fed President Jerome Powell announced another rate cut yesterday by a quarter point, with a target range now of 4.25% to 4.5%. Central banks around the world have been managing rates in an effort to fight inflation, but Fed officials are now expecting two rate cuts in 2025, down from the four that had been previously forecast, it was unexpected and threw Wall Street and fundamental analysts for a loop.
The Volatility Index (VIX) had it's second largest spike ever - surging 74% - as the Dow Jones Industrials Index dropped 1,100 points (-2.58%), while the S&P 500 Index dropped 178 points (-2.95%), and the NASDAQ Comp fell 716 points (-3.56%).
Bitcoin also had a fairly significant drop yesterday of nearly ~6%.
This activity of course resulting in some Reversals being elected. For those who had been studying the markets in the Socrates Platform, there had been flashing indicators on Daily and Weekly time levels. How will this year close out? We will see how the markets close this week and assess things from there.
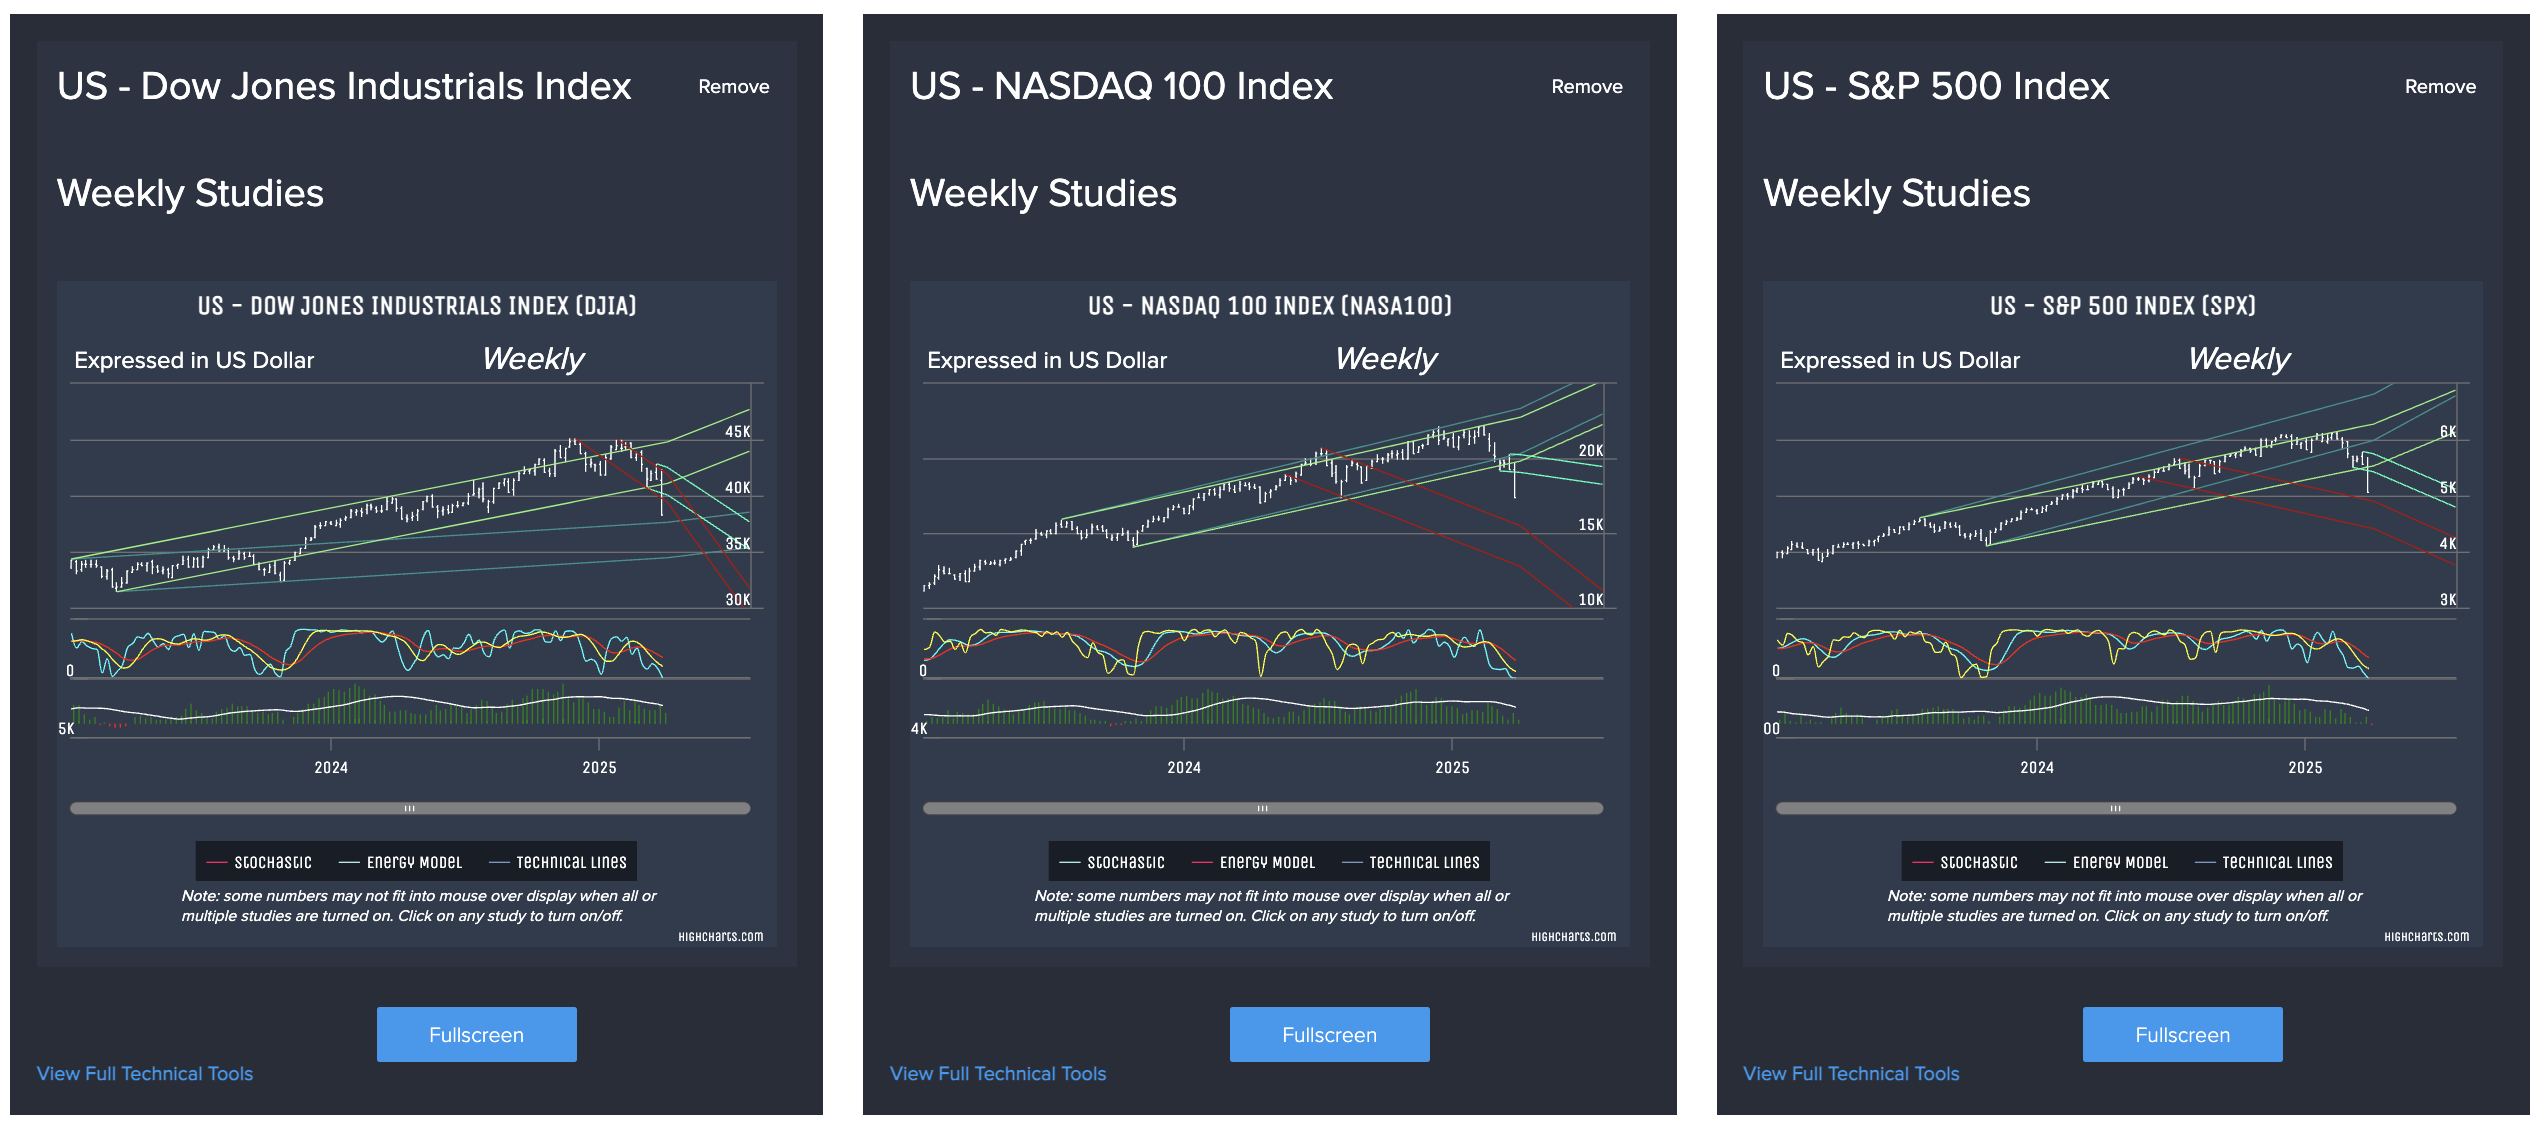
Taking a step back for now though, let's take a look at the price charts for a few major US stock markets after last night's closing.
On the Daily Time Level, you can see a relatively significant dip for the Dow Jones, the Nasdaq 100 and the S&P 500. In the case of the Dow and S&P, you can see the Energy Model had spiked well above it's moving average in recent weeks, followed then by a dip below it's moving average in recent days - particularly with the Dow going negative. Ironically, the Nasdaq 100's Energy Model was a little less volatile during this same time.

A look at the Weekly Time Level before this week's close is showing relative spikes in Energy in recent weeks for each of these markets.

Finally, how things look on the Monthly Time Level, you can see a much strong spike in Energy in recent months.

When studying price charts in the Socrates Platform, pay close attention to the trend lines and oscillators - the Stochastic and Energy Model in particular. When the Energy Model spikes well above its moving average, it indicates a higher risk of losing momentum, which could mean a change in direction may be ahead. In addition, the Socrates Platform includes a unique third stochastic line (yellow) and when it crosses both red (slow) and blue (fast) stochastic lines it can be a helpful indicator, especially if you see alignment with a notable change in the Energy Model.
More generally, the most common approach to studying stochastic indicators is to follow the numerical values: when >80 a market is considered in possible "overbought" condition; when <20 a market is considered in possible "oversold" conditions. Many also look for line crossovers to signal potential alignment of momentum and trend (red crossovers), along with price direction changes (blue crossovers). Keep in mind, the blue (fast) stochastic line is more sensitive to recent price changes, and this can be amplified if you are looking at daily price movement (vs Weekly or Monthly price movement).
Researching markets across different time levels offers a much better view of short-term vs long-term activity. Many follow financial markets on a daily basis, which can certainly be helpful - especially at times of potential market entry or exit - but it's important to keep in mind daily price movement (and indicators based on daily price movement) is most vulnerable to spikes in volatility with reactionary or false price moves. The monthly (and quarterly) time level tends to even out the noise a bit by contrast, providing a cleaner view of actual market trends over the long-term.
Regardless of time level, a change in direction can just be a (relatively) short-term move or brief market correction, it does not necessarily mean it is a true change in the longer term trend. This is why studying market behavior consistently over a period of time, and across multiple time levels (daily, weekly, monthly, etc) is helpful.
Also, while intra-day price movement is worth studying, the Socrates Platform proprietary computer models more heavily weight closing price for each time level as it's a stronger signal of sentiment for that trading period (that day, that week, etc).
Log in to research these and other global financial markets. Go beyond the charts with the Global Market Watch pattern recognition (monthly, quarterly and yearly in particular) along with the Indicating Ranges on a weekly and monthly closing basis. See how - or if - price movement aligns with what different technical indicators and models are picking up on across various time levels (weekly, monthly, etc). This can help shed light on what might be ahead on both a short and long term basis.
Pro and Enterprise members can go deeper in their research with the Reversal System and Timing Arrays, as they look for potential turning points ahead. Keep an eye out for clusters of Reversal points as they represent areas of technical support (Bearish Reversals) and technical resistance (Bullish Reversals). Take note of any relatively large gaps in where Reversal points exist, as it may highlight where a market could see notable price movement before reaching support or resistance.
Not a Socrates Platform member yet?
With over 1000 global financial instruments to research, from stocks, commodities, bonds, and more, the Socrates Platform allows members to monitor financial market activity from around the world using price charts, technical studies, custom watchlists, unique indicators, and proprietary computer models (the Reversals, Timing Arrays, Global Market Watch, Indicating Ranges, and the Energy Model).
Click here to compare membership plans, or sign up for Socrates platform today!